Wednesday, January 21, 2015

3 Antennas Compared

Recently we discussed the comparative performance of 3 wire antennas, sized for 80 m, on 3.5 MHz and above. I used antenna modeling to compare the following antennas, all at 40 ft above rocky ground:
  • W8JI 110 ft dipole
  • Horizontal Loop of 287 ft
  • 133 ft Off-Center Fed Dipole

I found that the shapes of the radiation patterns vary, but the peak total gain figures are similar among the 3 for the two frequencies I used: 3.5 and 7.2 MHz. Here is a summary of results:


Maximum Total Gain (dB)

@ 3.5 MHz @7.2 MHz
110 ft dipole 5.53 6.59
Horizontal Loop of 287 ft 6.39 5.83
133 ft OCF Dipole 5.74 6.42

Radiation patterns for the 2 frequencies are shown in this PDF file. If you zoom in enough you can read the data on each graph.  Patterns for additional frequencies are easily generated.

I used a similar side-by-side presentation in this 2010 posting when comparing two antennas sized for 160 m (110 ft or 130 ft wire to each side of the feed point).

WA5MLF


Friday, January 9, 2015

Feedline Loss & Other Characteristics

Here are some online resources you can use to calculate the loss and other characteristics for specified feedline types or geometries:

 If you want to find this and other posts in the future, be sure to use the blog's search feature. Look for this search box at the top left corner of the blog page

and enter your search term there.

In response, one or multiple blog postings will be presented if your search term matches one of the labels attached to a posting. This posting has the following labels attached: antenna, feedline, SWR.


Wednesday, December 31, 2014

End Fed Zep Antenna by N4NR

After some recent morning QSOs on 3740 kHz, there was email discussion about the antenna used by N4NR from his campground location in coastal Georgia. Several of our morning regulars were impressed by the 10 W SSB signal from Dennis. The antenna is an End Fed Zep. (This is a correction to my earlier posting.)

Based on an email response from Dennis, I put together a model of his campground antenna. For my initial analysis I did not include his RV, but a later analysis could add a metallic screen near the vertical portion of the antenna to approximate its effects. I expect that this would show up mainly on the higher bands where the radiation angles are lower.

Below is a series of screen captures from the 4nec2 antenna modeling software to illustrate the theoretical behavior of the antenna. Click on any graphic for a larger view.

First is a view of the antenna structure. 17 ft of 450-ohm ladder line starts at the rig (tuner), goes about 2 ft horizontally, then 15 ft up a fiberglass pole. A single wire, connected to one side of the ladder line, continues up to 22 ft, then continues on an upward angle to a height of about 50 ft for a total length of 84 ft. The other side of the ladder line constitutes the counterpoise. The graphic is to scale, so the two conductors of the ladder line are hard to distinguish. On this version I also used the program's feature to depict the magnitudes of current in the structure, represented by the short green lines. 
The ground parameters are for "marshy, forested flat ground", and the wires are all 12-gauge copper.
Antenna Structure


Next is a series of 12 screen shots showing radiation patterns for four selected frequencies.  I included patterns for total gain, vertically polarized and horizontally polarized. All patterns are oriented in the same direction as the structure graphic above (x-axis and horizontal wires going to the right). The total and vertical patterns are from a low angle facing the antenna broadside, and the horizontal patterns are from directly above the antenna. Click on the slide show below for a better view of the individual slides.


Below you can view impedance plots for two frequency ranges: 3 to 14 MHz and 3 to 29 MHz. Click on any image for a larger view.


Impedance Parameters, 3-14 MHz

Impedance Parameters, 3-29 MHz


Happy New Year!
John WA5MLF


Thursday, November 20, 2014

Spectrum waterfall views on 60 m

During this morning's QSO I captured screen shots of the waterfall display of received signals on my Flex-3000. Below are the views with stations identified, as heard during the 0755 to 0810 CST time frame. (Click on any image for a larger view.)

Above is the display while WA4PTZ was transmitting. The vertical dimension is about 30 seconds of elapsed time. The 60 m channel 1 bandwidth is represented by the gray shading on the top edge. The carrier frequency is marked with a red line. The lighter patches show the received SSB signal level compared with background noise. Some persistent signals (or artifacts) are seen around 5.328 MHz.


Above is the signal display for W4PRE.


Here is the signal view for W4UOA.


Above is a view showing transmissions from KB4XX and W4UOA.


Here is a longer transmission from KB4XX.


For a different view, see the screen shot below from 40 m (7.143 MHz) at about the same time of the previous morning. This shows transmission from KB4PYR with a strong QSO in progress "next door" at 7.140. The yellow and red colors signify much stronger received signals, compared with the 60 m views above.


-- John

Thursday, October 30, 2014

Trying a New Chat Room

While trying out a new chat room set up by W4UOA, we've learned about its features and how to use many of them. Below are some notes and graphics that illustrate some of what we know for now. These may help folks to get more familiar with the chat room usage.

When you open the chat room link in your chosen web browser, the first thing you will see is the log-in box shown below.
The nickname is what displays for you in the chat room. A popular choice is the user's call sign, possibly with a name or other information added. This can be changed at any time during the chat session without logging off.

The main chat window looks like the image below. Click on it for a larger view.
Your nickname will appear at the left end of the Text Entry Box, just below the chat window. Click on it if you want to change it, such as to append extra info.

On the right is the Online Users Box where all logged-in users appear.

The next image below identifies the details of the tool bar that is below the Text Entry Box. Click on the image for a larger view.
The actions of each tool bar button are also identified when you hold your mouse pointer over a button during your chat session. It is good practice to click the disconnect button when you are done with you chat session.

The sound notification (beep) is intended to let you know when anyone posts new text while your attention is elsewhere. You can silence it using the button show. Otherwise, you should hear a beep if ALL of the following conditions are satisfied:
  • Your computer is able to make sounds from other programs (e.g. speakers are on)
  • Adobe Flash is not blocked for this chat app (this may depend on your browser settings)
  • Your mouse pointer is somewhere other than the text entry box of the chat room. If you are actively using the chat room you can seen new posts as they appear.)
As with any web page, you can change the text size by pressing Control + (for larger text) or Control - (for smaller text).

Since this chat app does not use Java, it can be used on mobile devices, too. In my experience, the chat session timed out after a short period of inactivity on one Android and one iOS device, but resuming the chat session was quick.

There are many features that we can customize in this chat app. We invite your comments as we continue to evaluate this chat solution.

John
WA5MLF

Tuesday, September 16, 2014

FoxDelta Analyzer at Tuner Input

Here is an example of what the FoxDelta Antenna Analyzer sees when connected to the input of my LDG AT-100Proll. The graph has plots for three frequencies at which the tuner was tuned:
  • 3740 kHz  - Blue curve
  • 7191 kHz  - Red curve
  • 14200 kHz - Green curve

Click on the image above for a magnified view. 
All plots were done with my 80 m horizontal loop antenna connected to the output of the tuner. For each frequency I performed the following steps:
  • Tuned the tuner for minimum SWR with the transceiver as a source at the selected frequency
  • Connected the analyzer in place of the transceiver
  • Ran a scan from the analyzer software

Using the analyzer mode that enables 3 separate scans to be displayed on a single graph, I saved the composite graph and added frequency labels next to the color legend at the bottom of the graph.

You can see that a good dip in SWR is obtained for first two frequencies. At 14200 kHz, however, the short (84-ft) feed line length did not allow the lowest SWR to be obtained within the 20 m band.

Wednesday, September 3, 2014

TPWINLOG -- Editing log file

During a morning HF roundtable QSO we discussed the ability to edit a log file created by TPWINLOG. Section 7 of the program's ReadMe file discuss the format of the log file.

A user may want to edit the log file in scenarios such as:
  • Error (e.g. name or call sign) discovered just after a contact is logged
  • Duplicate contact logged intentionally with DUPE tag for later correction
  • Error in band or mode recognized and noted for correction while not operating the event

UPDATE 23 Oct 2020: In the most recent versions of the program the log file is named tpqsolog.txt. The instructions below are otherwise still valid.

After exiting the TPWINLOG program, during a break in operating or after the event concludes, you may use a plain text editor program (e.g. Notepad) to edit your log file QSOLOG5.TPQ. It would be prudent to first make a backup copy of the file. When editing the file, it is best to avoid changing the lengths of certain data elements: chapter, band, mode, date, time. The call sign, name, and comment fields will be of variable length.  After editing QSOLOG5.TPQ, when you run TPWINLOG the contact log display and scoring will be updated to reflect the edits. Now you can run the Print feature to generate the output log report on paper or in a file for emailing.

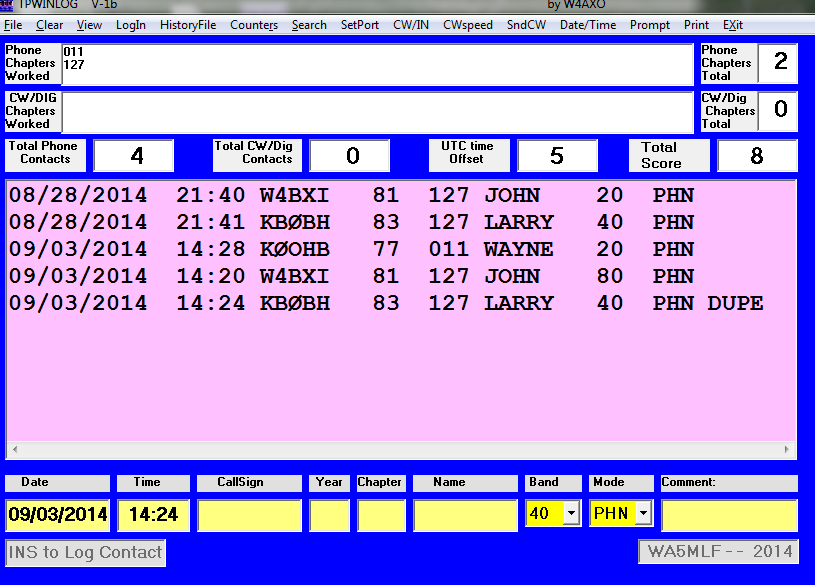
Below is a series of screen shots showing a log of 5 practice log entries and an edit applied to one contact. (Click on any image to expand the view.) The first shows a 5th contact was identified by the program as a duplicate, but was accepted by the operator as a DUPE entry and is not counted in the tally of 4 contacts.


The next screen shows the QSOLOG5.TPQ file opened in a plain text editor. In this example, the operator forgot to change the band to 80 m, but logged the contact as a dupe for later edit. He could have changed the band before Inserting (logging) the contact.


The next screen highlights the changes in the band and the comment field (removing the DUPE tag).

Finally, when the TPWINLOG program is re-started, the log screen reflects the revised tally of 5 contacts.
As noted previously, it's a good idea to practice using the program to log practice contacts and to print the log results. Just be sure to delete the practice contact log before CQ TP starts. See section 4.1 of the program's ReadMe file.